

Type "skincare" into any spy service, and the resulting number will look impressive. On the Adligator heatmap for the past year, there are 34,037 results in the UK, 32,862 in the US, and 32,226 in France.
But there is one small problem with this figure: it is not the actual volume of the skincare advertising market.
This is simply the number of ads that literally contain the word "skincare" in the text. Meanwhile, almost all retinol serums, hyaluronic acid sticks, dermatologist tests, K-beauty sets, scalp massagers, and 90% of arbitrage funnels—where this meta-term is never used—are completely missed. This same trap applies to any vertical: type in "iGaming" and you’ll get nothing, because no advertiser writes the word "iGaming" in a Plinko slot ad.
For the workflow described below, we use Adligator—the only Meta spy service that provides the data depth this article relies on. Below is a five-minute weekly routine, along with a framework for choosing the right keyword in any niche.
Why Scrolling the Meta Ad Library is a Waste of Time
The Meta Ad Library is free. But it’s essentially a museum.You can type in anything and get a wall of mostly inactive creatives. Here is what you cannot do, even after sitting there for an hour:
Filter advertisers who are actually scaling right now from those running two-year-old stale creatives.
See the GEO distribution for a keyword at a single glance.
Filter "ads that were still running yesterday."
Export the number of rejected ads—one of the most useful signals regarding moderation policies in arbitrage.
Spot general patterns: which color palettes are winning, which headlines repeat, and which landing page URLs the entire vertical is driving traffic to.
The solution isn't just a better tool. It’s a workflow that takes five minutes a week. Step zero (and the one most often skipped) is mapping out your keyword semantics.
Step 0: Breaking the Vertical Down into Real Keywords
Real advertisers don't write "skincare" in their copy. They write:
Brand names — Eucerin, CeraVe, NIVEA, La Roche-Posay, The Ordinary, SK-II.
Active ingredients — retinol, hyaluronic acid, niacinamide, vitamin C, peptide.
Results — anti-aging, dark spots, acne, wrinkles, "glow."
Funnel slang — skincare quiz, dermatologist’s secret, before-after, free sample.
Choose five keys that collectively cover about 70% of the vertical. Your set should include at least three of these four categories. For skincare, a solid working set looks like this: retinol + anti-aging + Eucerin + skincare quiz + hyaluronic acid.
How to pick the right keyword for any vertical
The framework is the same whether you work with skincare, iGaming, nutra, sweeps, fintech, or crypto. Five quick checks:
Avoid the category name itself. "Skincare," "iGaming," "nutra," "crypto"—nobody writes these macro-terms in ad copy.
Choose one ingredient/mechanic, one result, and one brand. Ingredient = what is literally in the product (retinol; Plinko; semaglutide). Result = what the customer is trying to get (rejuvenation; instant withdrawal; weight loss). Brand = a major player in the niche (Eucerin; Stake; Hims). These are three different angles on the same vertical.
Add one piece of funnel slang. Every vertical has its own. Skincare → "quiz." iGaming → "free spins." Nutra → "1 weird trick." Crypto → "automated trading." These are arbitrage keys; they reveal the funnel mechanics.
Check the result count in 30 seconds. Plug each candidate into Adligator. If it gives 50 ads, replace it with a broader synonym. If it gives 50,000—narrow the query. The ideal volume for tracking is roughly between 1,000 and 30,000 results.
Choose the "fattest" key as your primary tracker. This is the word whose analytics dashboard will yield the most significant data. For most verticals, this is an ingredient or mechanic, not a brand or funnel slang. Retinol instead of Eucerin. Plinko instead of Stake.
Once the keyword map is ready, the rest of the work becomes purely mechanical.
Step 1: One Vertical, Completely Different Ad Markets
This is the moment Step 0 fully pays off. One vertical, two keywords, two completely different ad markets.
Top 10 markets for the keyword "skincare" over the past year:
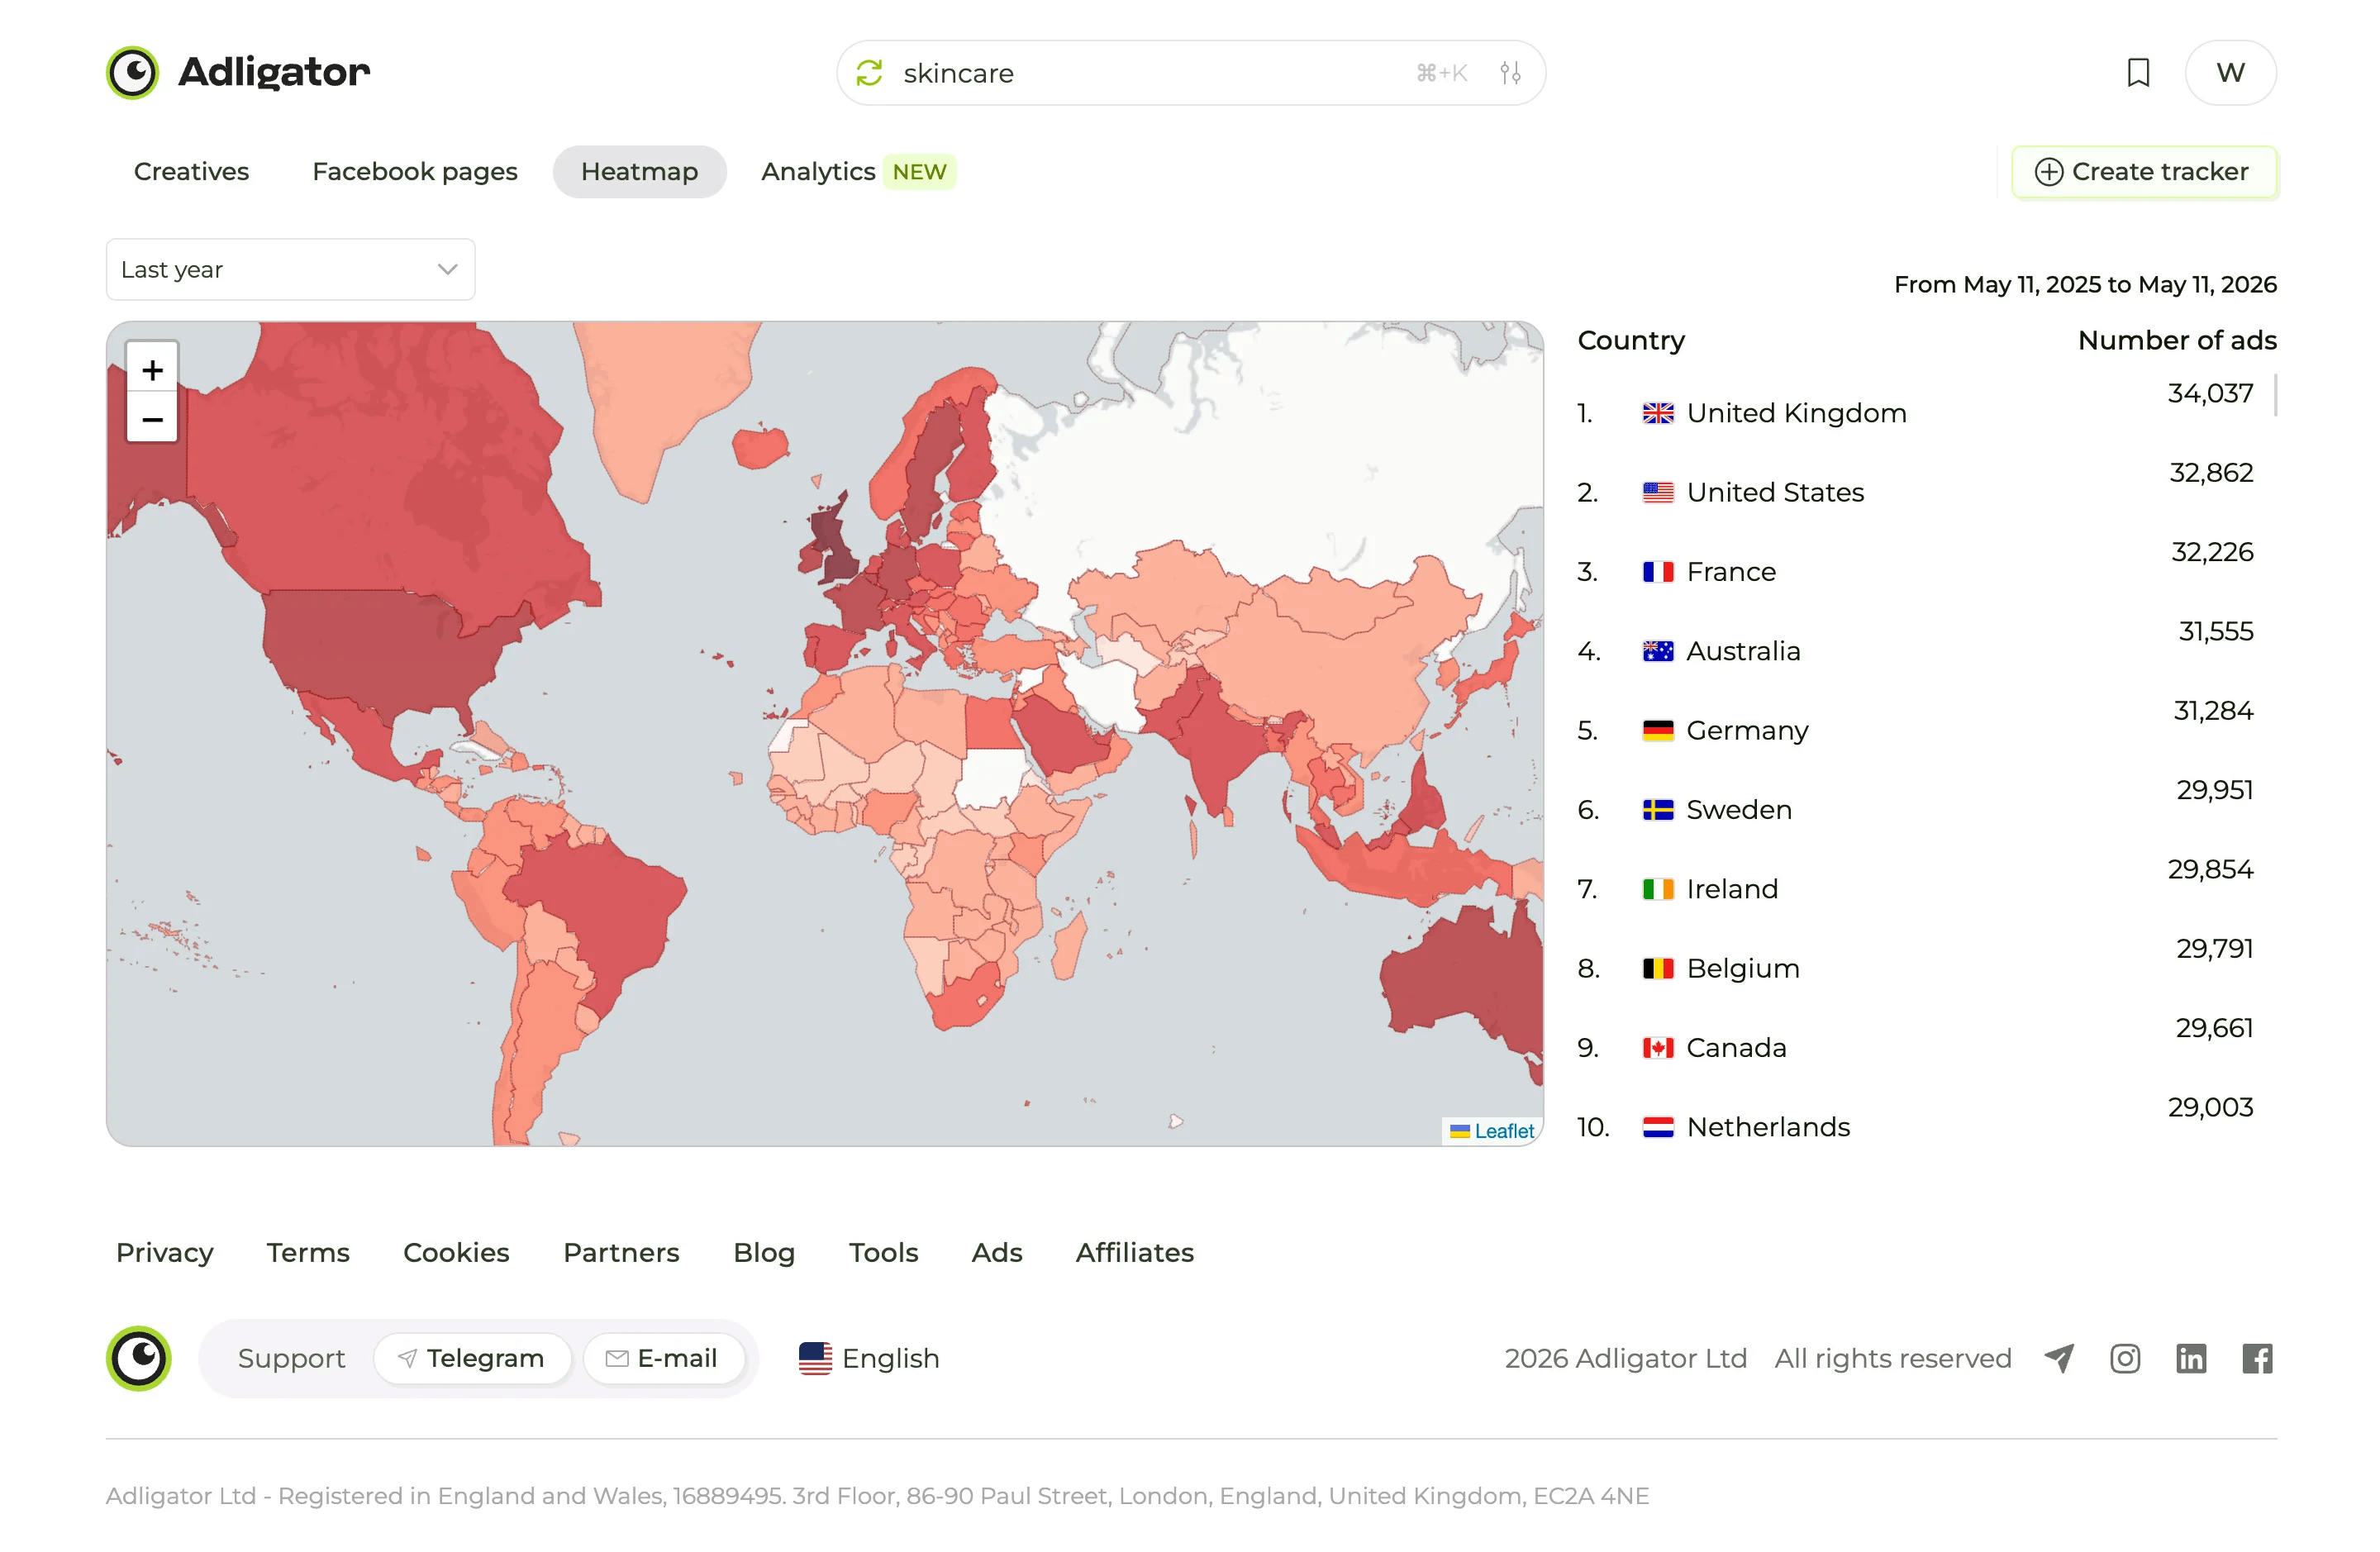
[Adligator heatmap for the "skincare" keyword — top 10 markets: UK (34,037), USA (32,862), France (32,226), Australia (31,555), Germany (31,284), Sweden, Ireland, Belgium, Canada, Netherlands — almost entirely English-speaking countries and Western Europe]
The Western English-speaking world + Western Europe. High income, high spending on cosmetics, a mature DTC (Direct-to-Consumer) market. This is the "branded" side of the vertical.
Now, the same heatmap for the keyword "retinol":
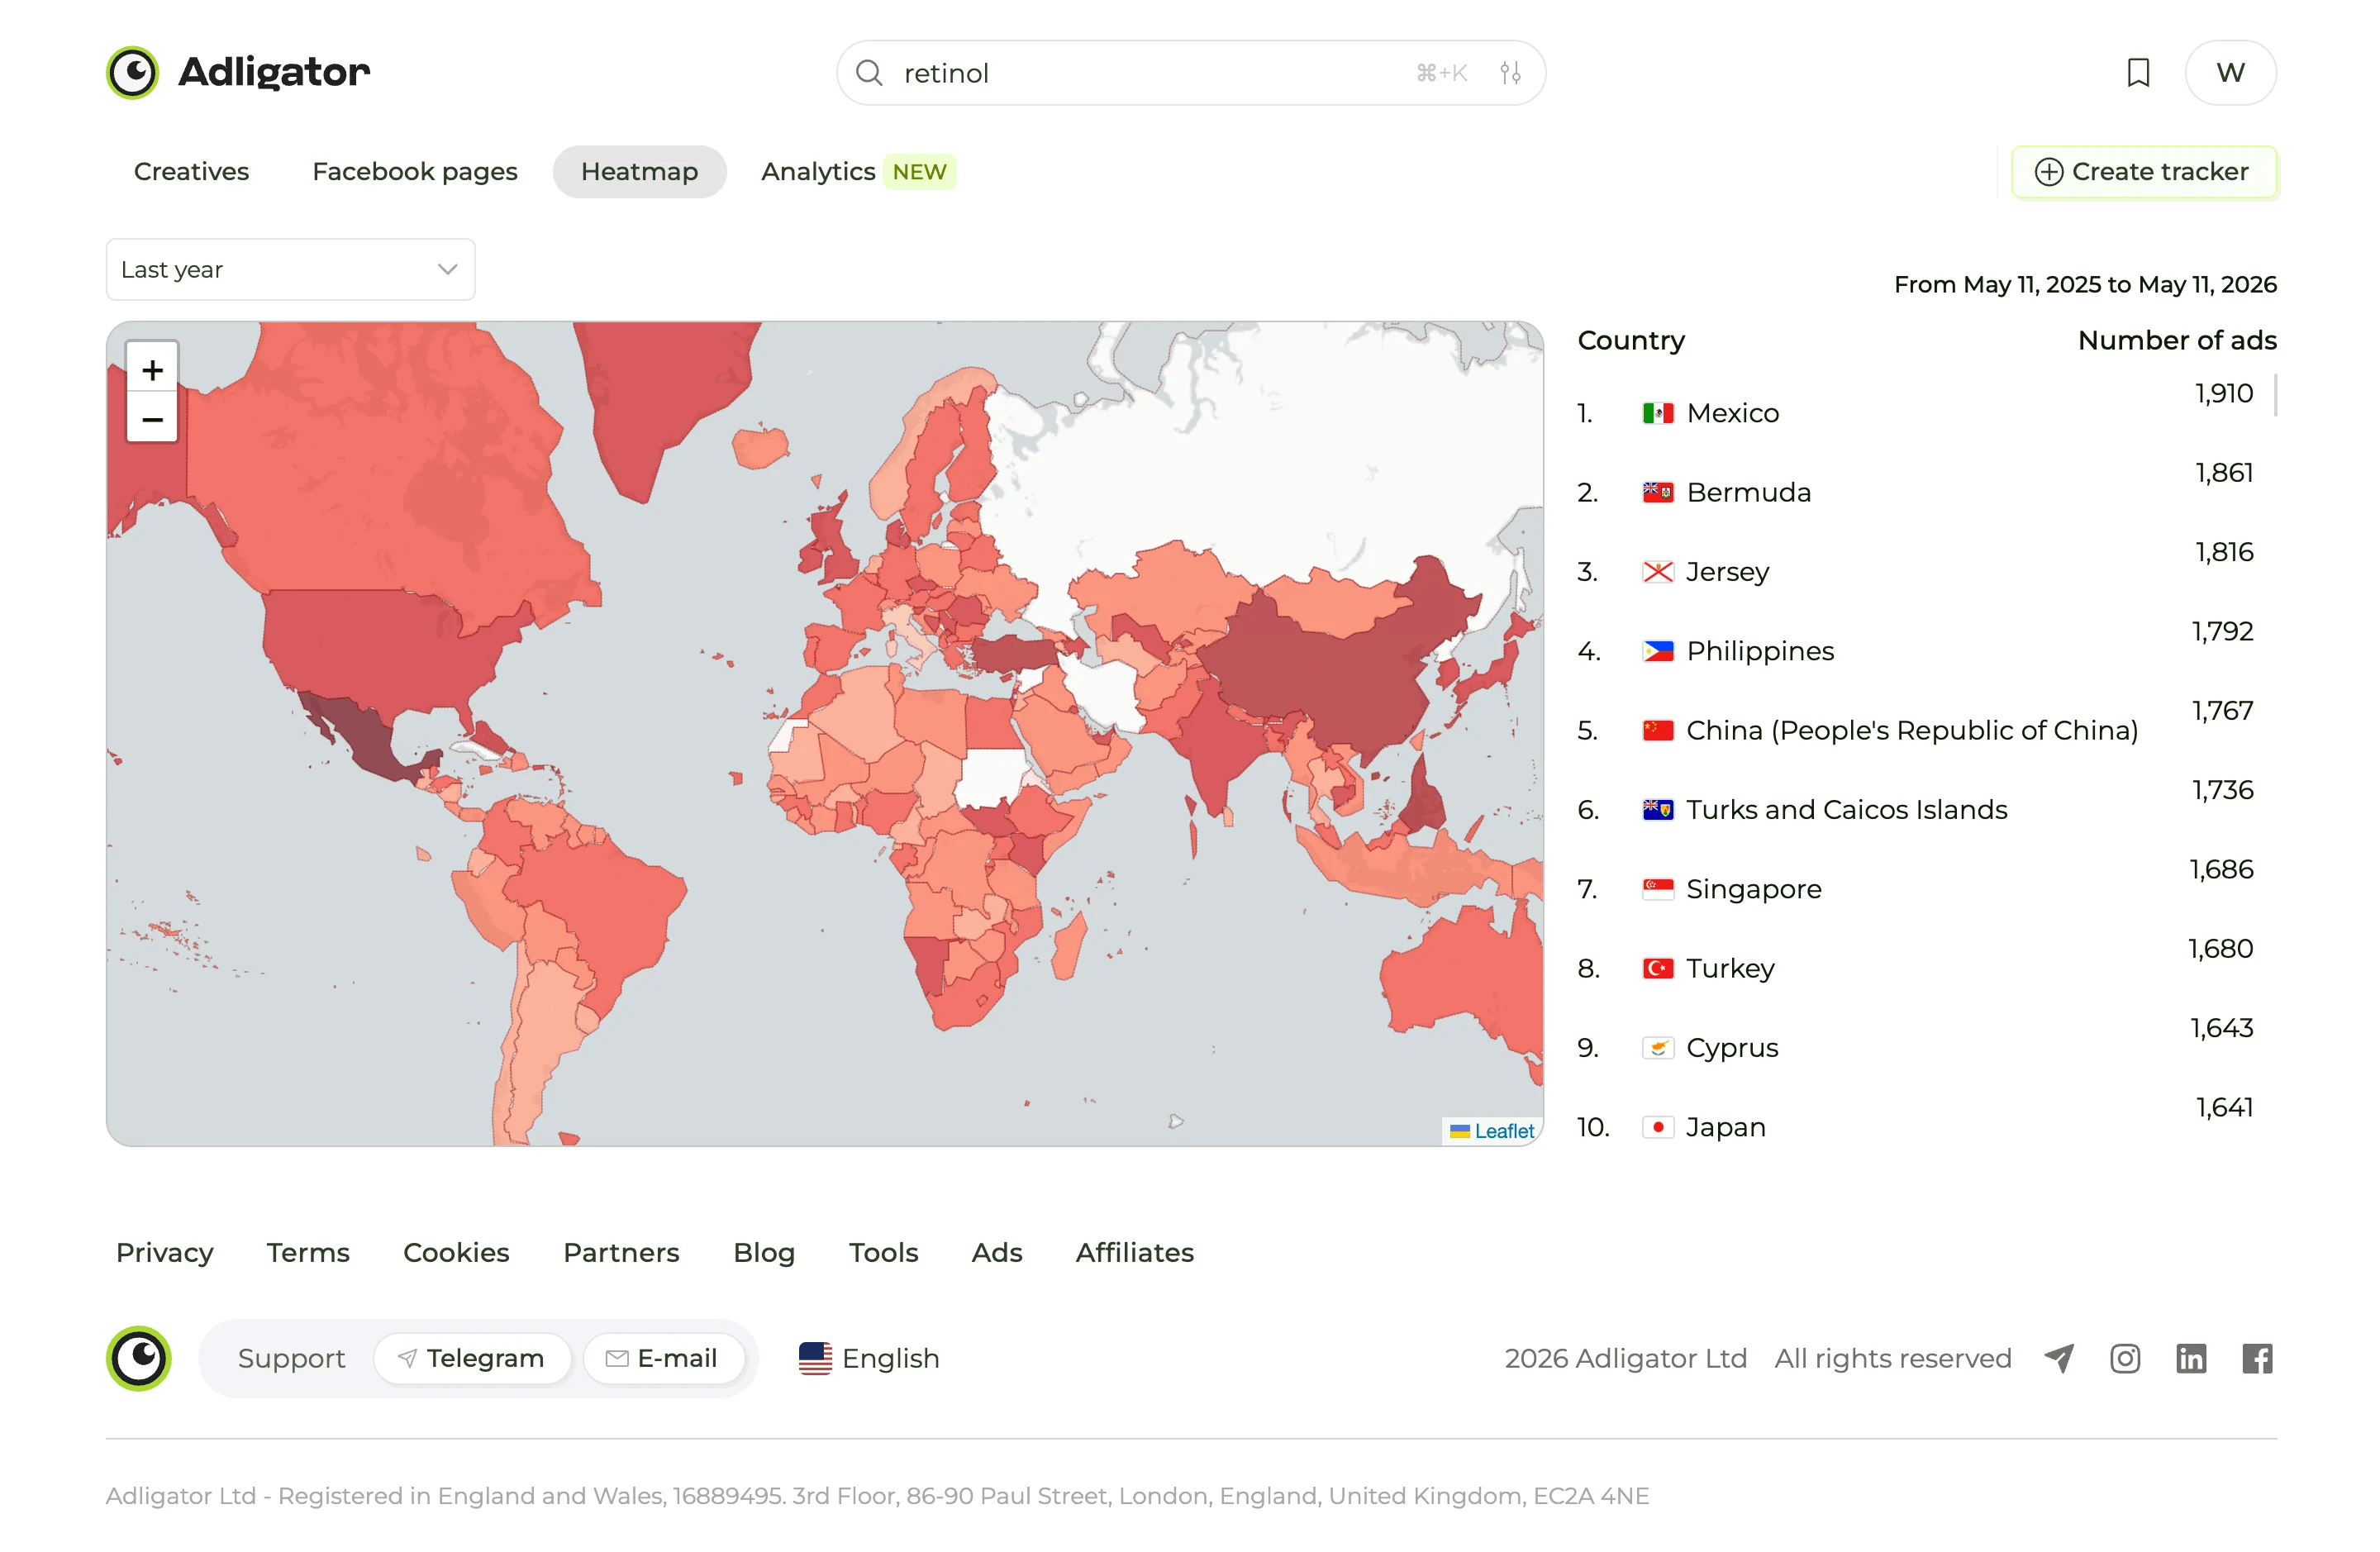
[Adligator heatmap for the "retinol" keyword — top 10 markets: Mexico (1,910), Bermuda (1,861), Jersey (1,816), Philippines (1,792), China (1,767), Turks and Caicos Islands (1,736), Singapore (1,686), Turkey (1,680), Cyprus (1,643), Japan (1,641) — LATAM, small island territories, and Asia]
LATAM + island territories + Asia. This is exactly where the arbitrage side of this vertical lives.For Cloaking.House readers, this indicates two things:
Small island GEOs (Bermuda, Jersey, Turks and Caicos) are a marker that ads are running through offshore advertising companies. Population of Turks and Caicos: 46,000. Ads last year: 1,736 creatives. This isn't consumer demand—it’s the place of company registration.
The Asia + LATAM cluster is where dropshipping serums and quiz funnels are scaling right now. Lower CPM, lenient moderation, and a hungry audience for whom retinol is a entry-level staple.
Searching only for "skincare" gives you a map of the Western market and zero arbitrage signals. That is the price of skipping Step 0.
Step 2: Reading Advertiser Signals for Each Key
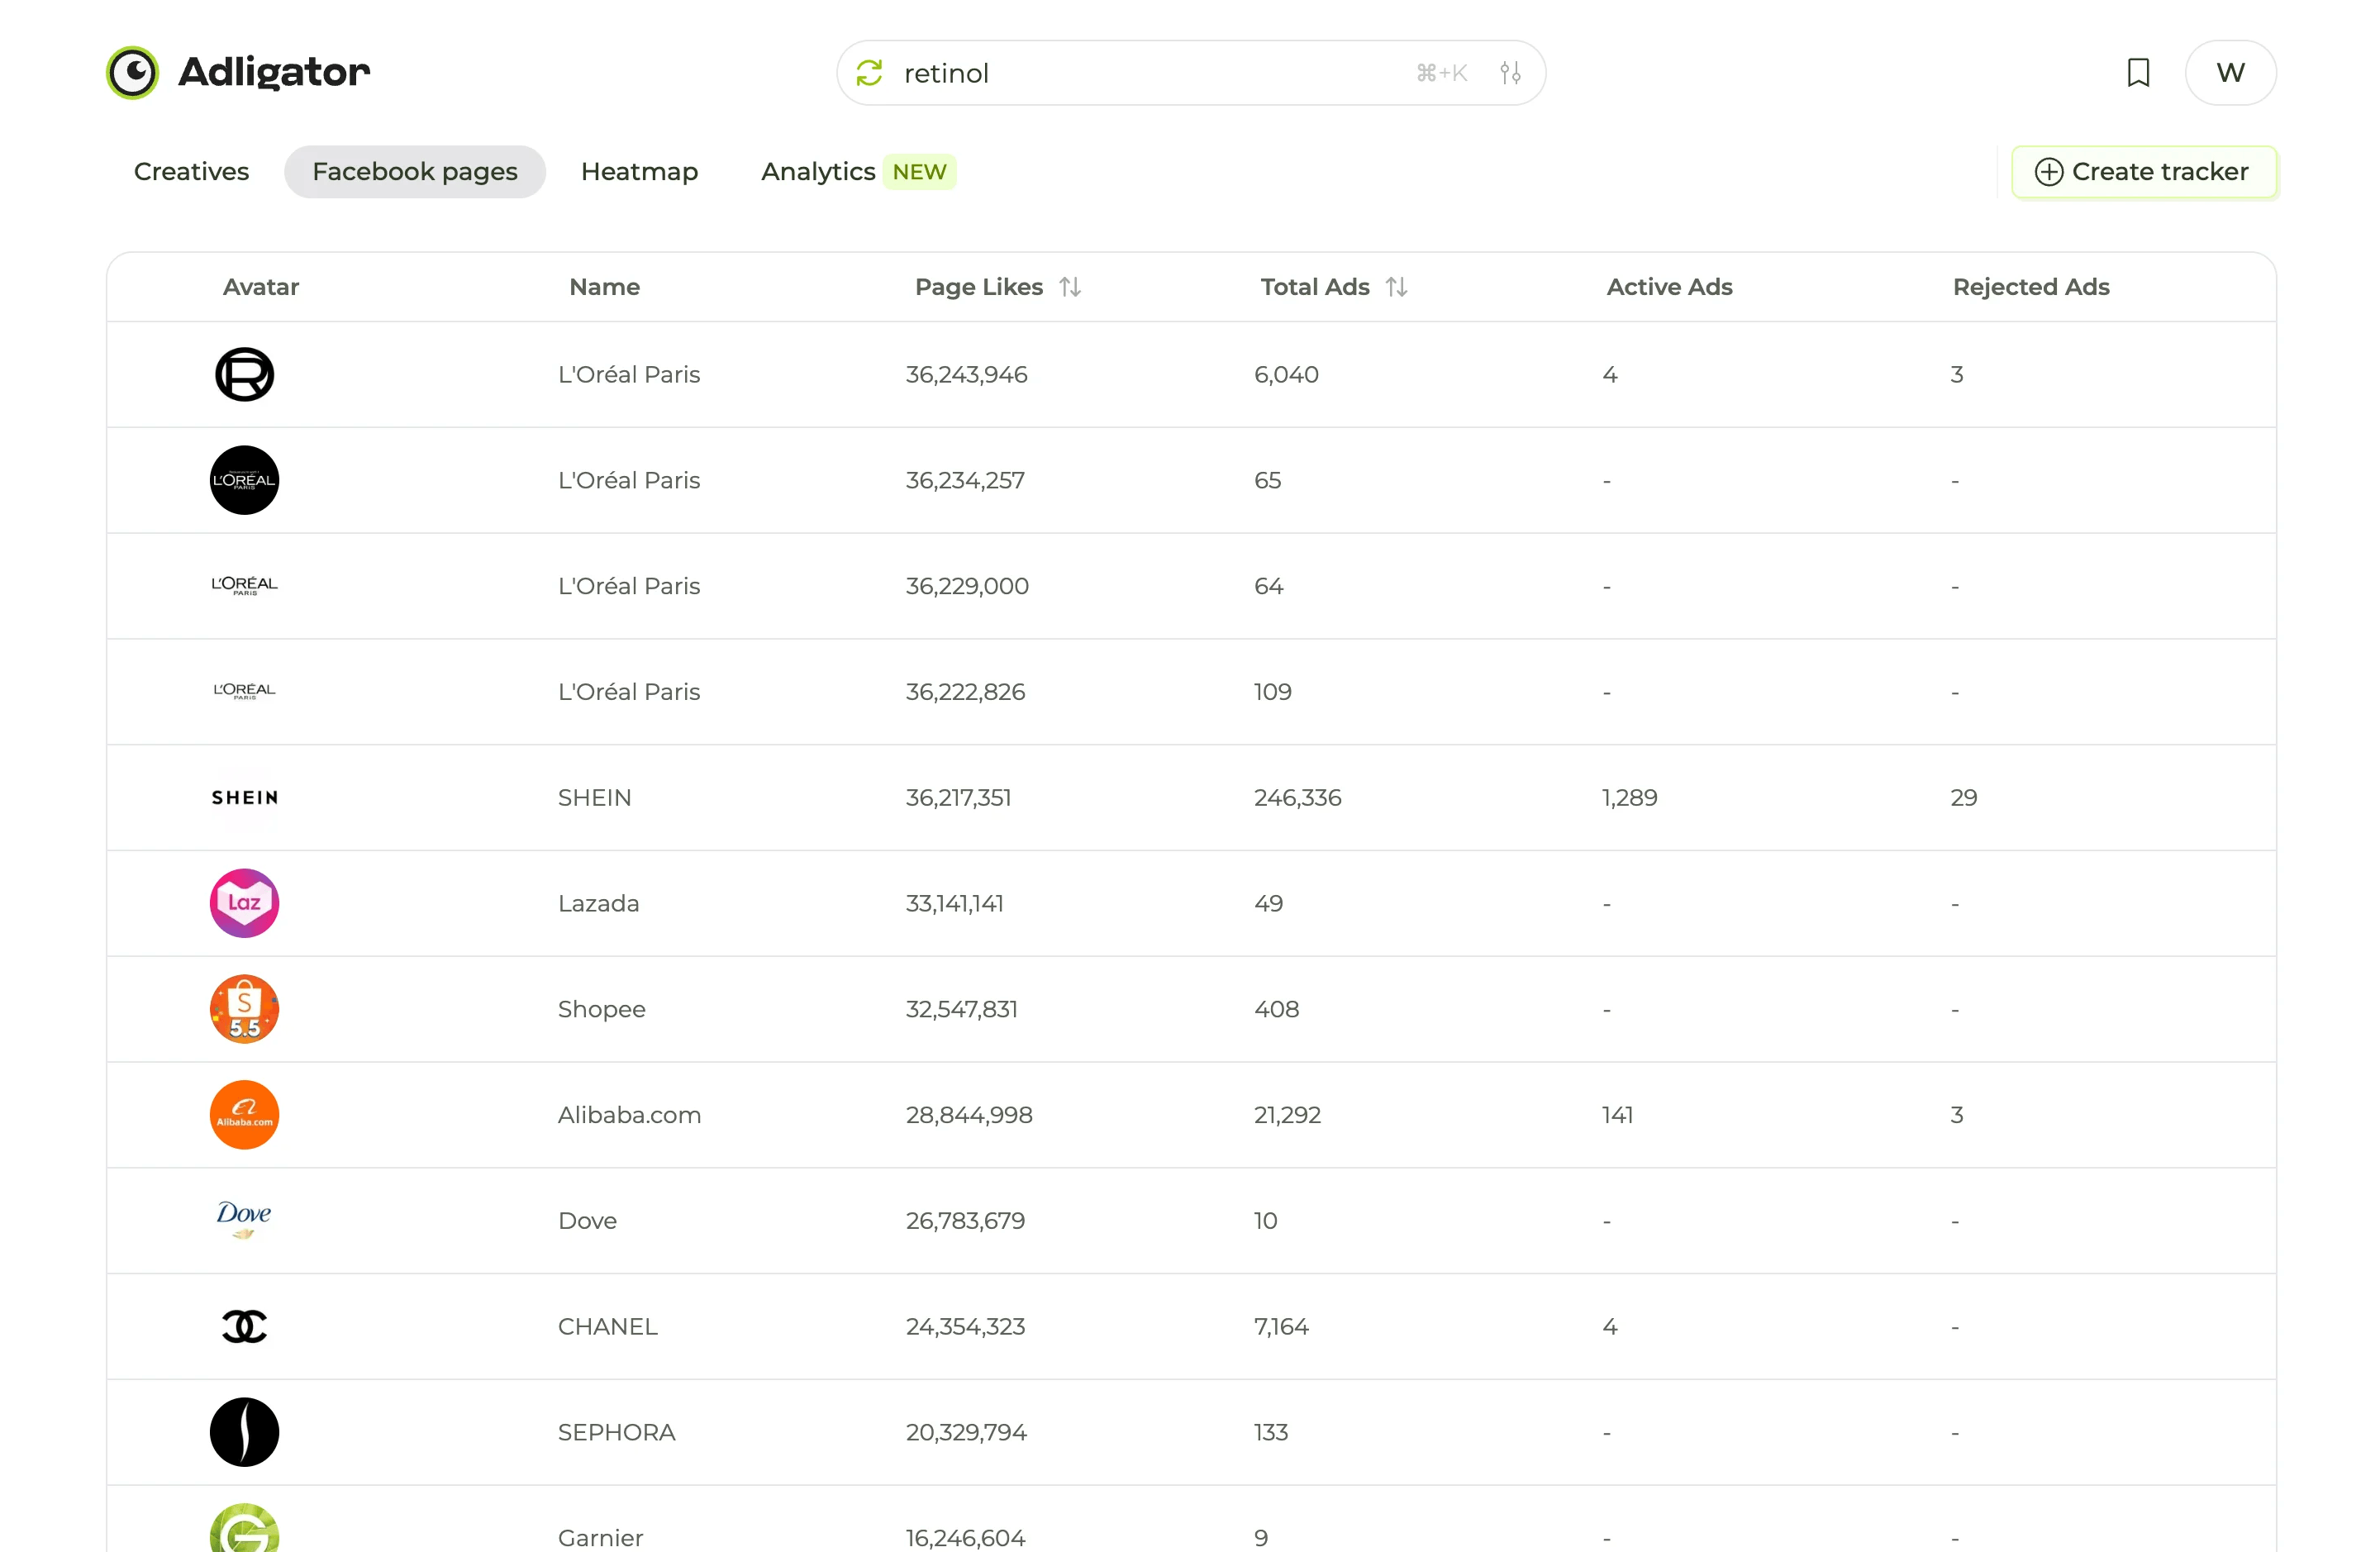
Switch to the Facebook pages tab. Every page that has launched at least one ad mentioning your keyword will appear here with three columns: Total Ads, Active Ads, and Rejected Ads.
A subtle but vital nuance: these are the lifetime metrics of the entire page, not just stats for your specific keyword. A page appears in the list because at least one of its creatives matches your key. The numbers themselves tell you about the page’s overall library—how big it is, how much is still active, and how often it catches bans. The keyword decides who shows up; the columns describe their overall ad strategy.
For affiliates, this is a much more useful signal than it seems. Here is the top for the word "retinol":
What these stats actually say when read correctly:
L’Oréal Paris uses four different Facebook pages that have run retinol creatives. Regional splitting, personalization, or backup fan pages for moderation—pick any interpretation. The point is the fact of four parallel pages under one brand, not the count on each.
SHEIN's presence in the list. The appearance of a fashion giant in the retinol results means they’ve recently pushed creatives mentioning it. Combined with their massive library and a non-zero reject counter—this is a signal from the "grey" zone worth watching.
Alibaba.com appears in both "skincare" and "retinol" with identical numbers—because these are the figures for the entire Alibaba library of all time. This actually means Alibaba pops up for almost any cosmetic term.
Active ÷ Total = what portion of ads launched all-time are running right now (across all campaigns, not just your key). SHEIN, CHANEL, NIVEA—they scale (or don't) the entire brand. Pages where this ratio grows sharply week-over-week are those that have found a profitable funnel in their operations. If they appear under your key, take note. For volume analysis on a specific key, it's better to use the Analytics tab in the tracker.
Step 3: Saving the Cycle as a Tracker
This is where Adligator stops being a search engine and becomes part of your weekly routine. Trackers do two things other spy services can't:
They run your search automatically every night and send you an email the next morning with only the creatives launched since yesterday. You don't need to search again. You drink your coffee and look at the fresh digest.
They unlock the Analytics tab—a full aggregated dashboard for all ads found by the tracker. Headlines, calls to action (CTA), main texts, links, color palettes, launch matrix by day of the week, and format splits. No one else in the Meta spy category provides this picture.
On our team account, we have a "retinol" tracker running constantly. Creating it took 15 seconds: entered the key, clicked + Create tracker, named it, done.
Two things to know before creating:
Slots are limited by the plan. Free: 0. Pro: 7. Team: 14. Choose keys where you actually need a daily feed, not your entire semantics list.
The Analytics tab opens for each tracker individually, not the account as a whole. A Pro user with a retinol tracker has a full analytics dashboard specifically for retinol.
If you set up only one tracker, put it on the keyword that will yield the richest analytics. For most verticals, this is an ingredient or mechanic, not a brand.
Step 4: Reading the Analytics Dashboard
This is the dashboard that competitors lack, and one scroll gives more insights than an hour of clicking individual creatives. Here is the retinol tracker data for the last 12 months:
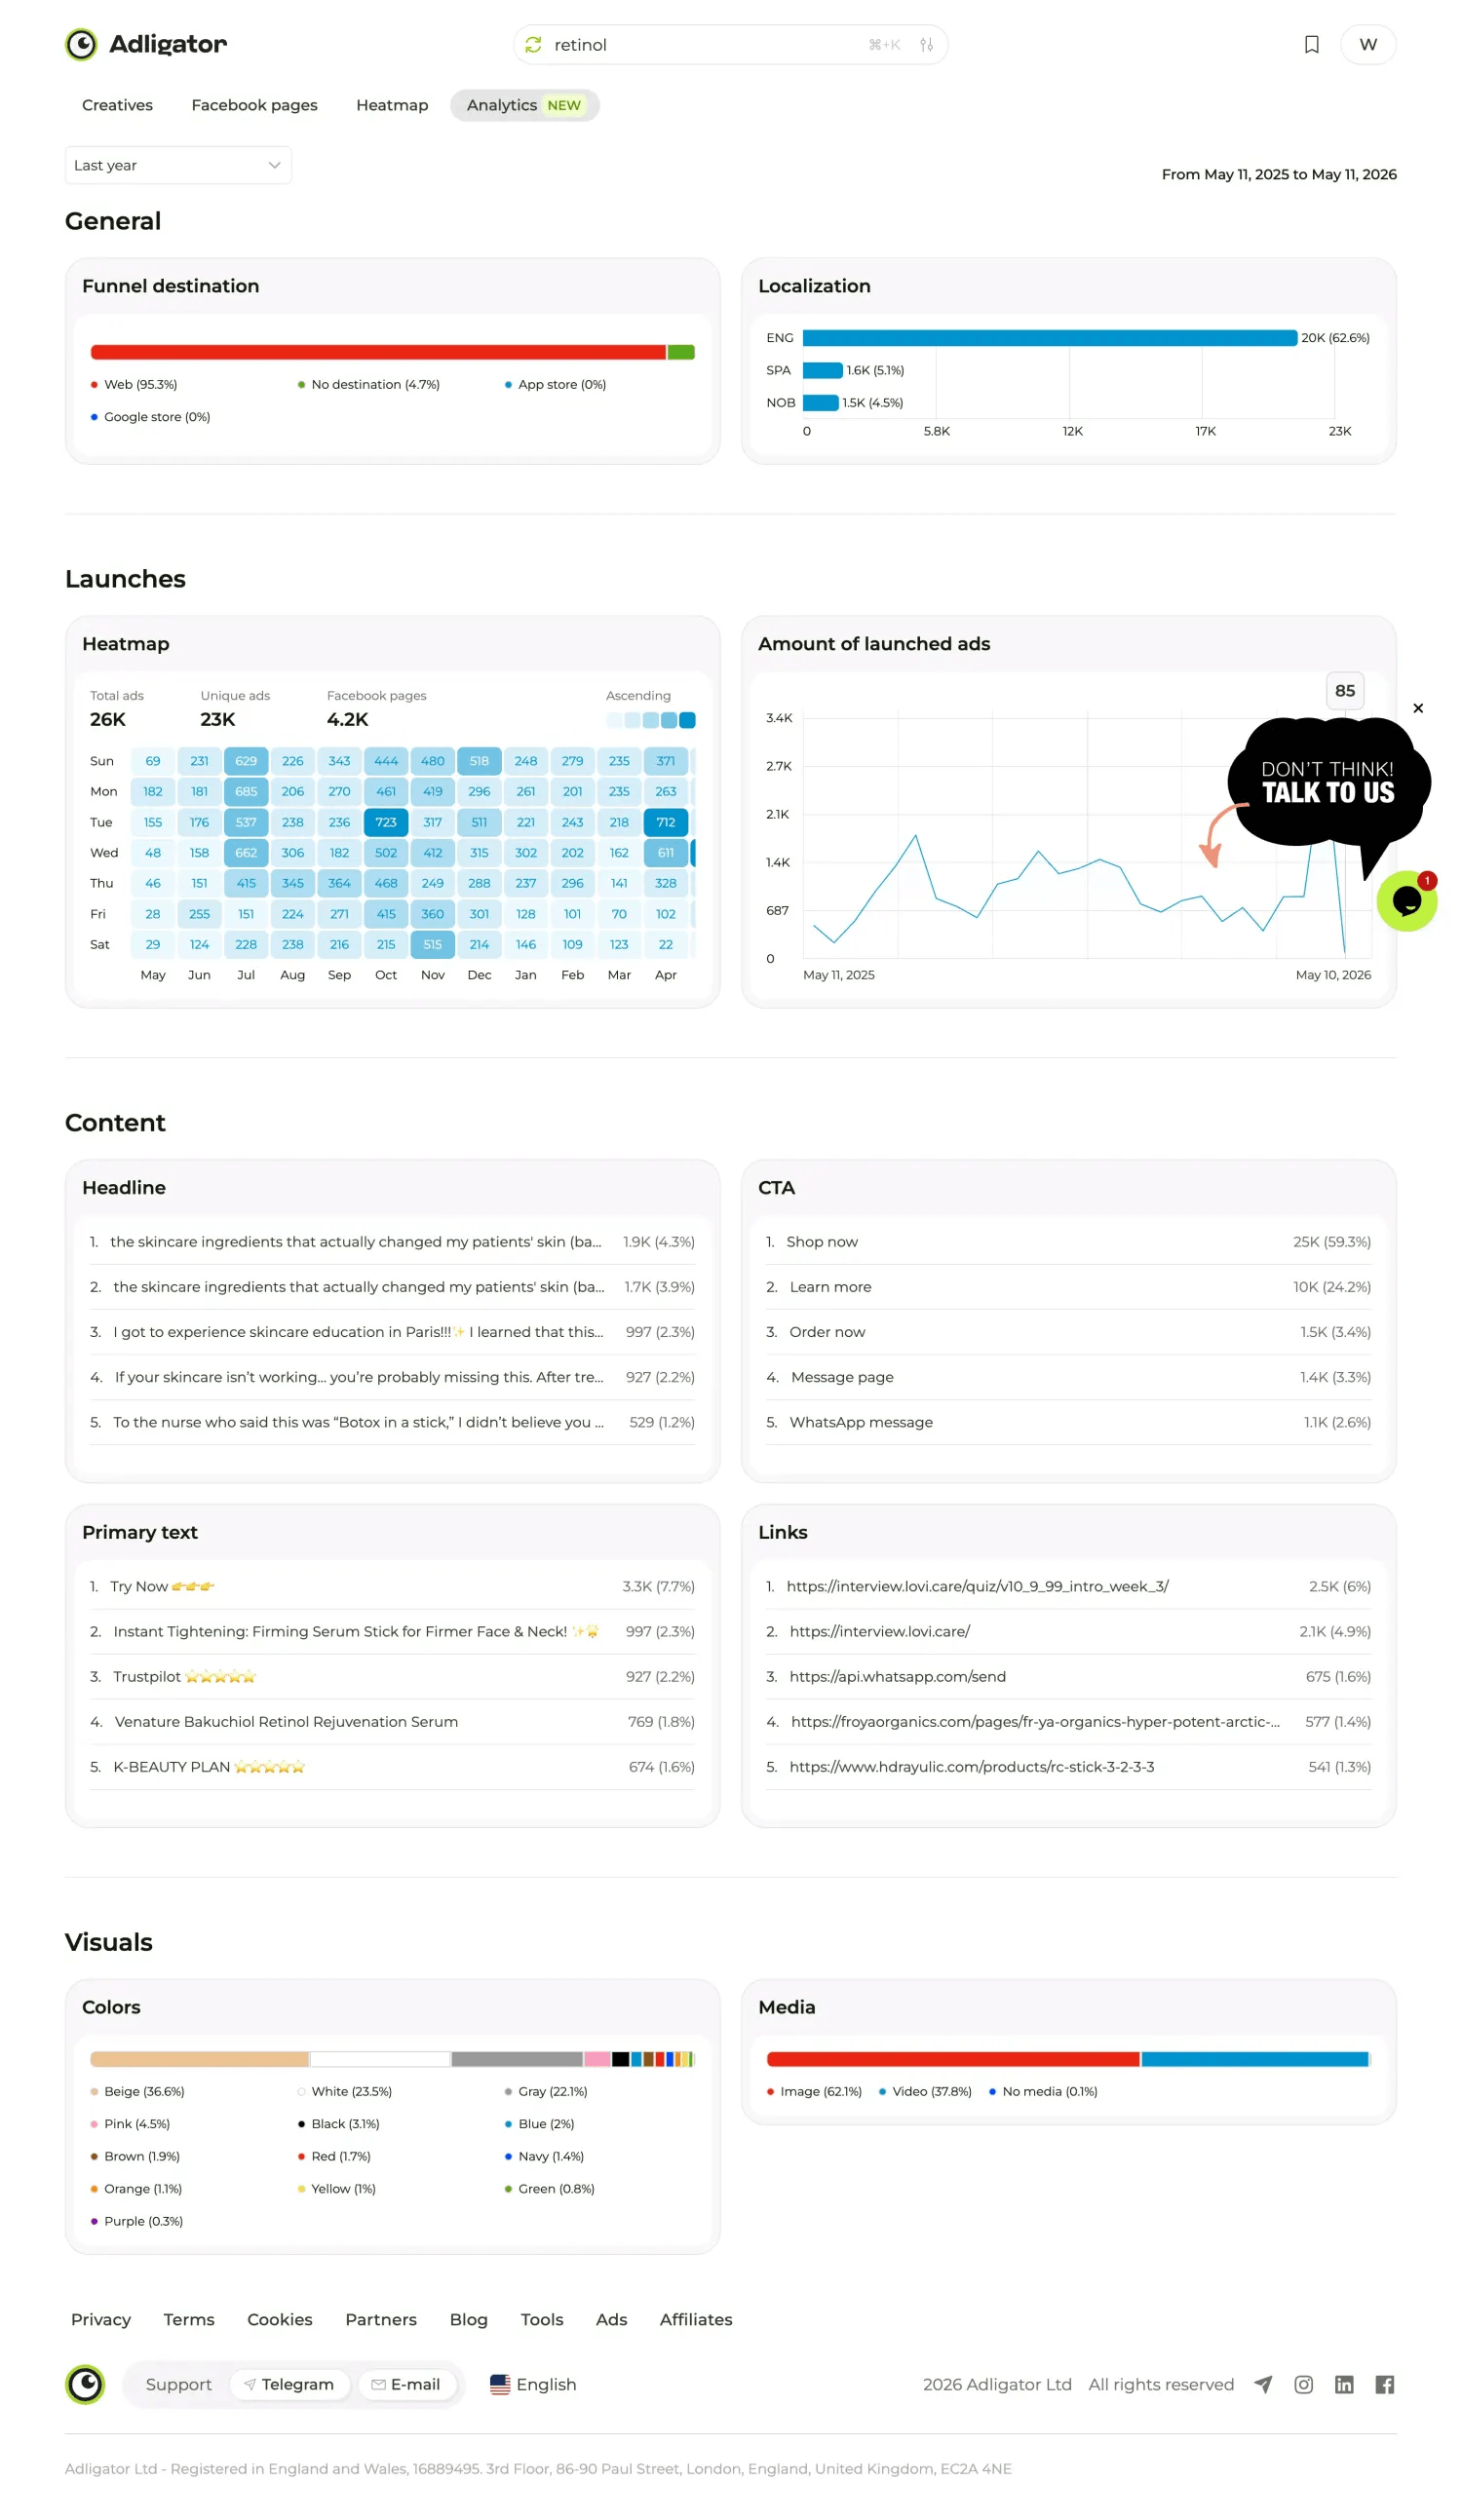
[Analytics dashboard for the retinol tracker — sections: General (Funnel destination: 95.3% Web, Localization: 62.6% English / 5.1% Spanish / 4.5% Norwegian), Launches (Launch heatmap: 26K total / 23K unique / 4.2K FB pages), Content (Top Headlines / CTA / Texts / Links), Visuals (Colors and Image/Video split)]
Let's go top to bottom:
Funnel destination. 95.3% Web. Almost 0% App store. Retinol is a vertical of Shopify and landing pages, not app installs. Task your designers with click-to-LP transitions, not installs.
Localization. 62.6% English, 5.1% Spanish, 4.5% Norwegian. The massive English lead is predictable. But Norwegian is a surprise: it’s a small market, but Scandinavia consistently shows great LTV in cosmetics.
Launch heatmap. Format: "day of the week × time of day." The hottest cells (Sunday 629, Tuesday 723) are when everyone launches. You can fight for impression share there or, conversely, intentionally avoid those windows for the same reason.
Content (your swipe file). This is where the maximum utility lies:
Visuals — Colors and Media. Beige 36.6%, white 23.5%, grey 22.1%. Clinical minimalism. This is the aesthetic the audience's eye trusts in this vertical. Format split: 62.1% static (images) vs 37.8% video. Images are still winning in skincare, contrary to the "everything is video now" trend.
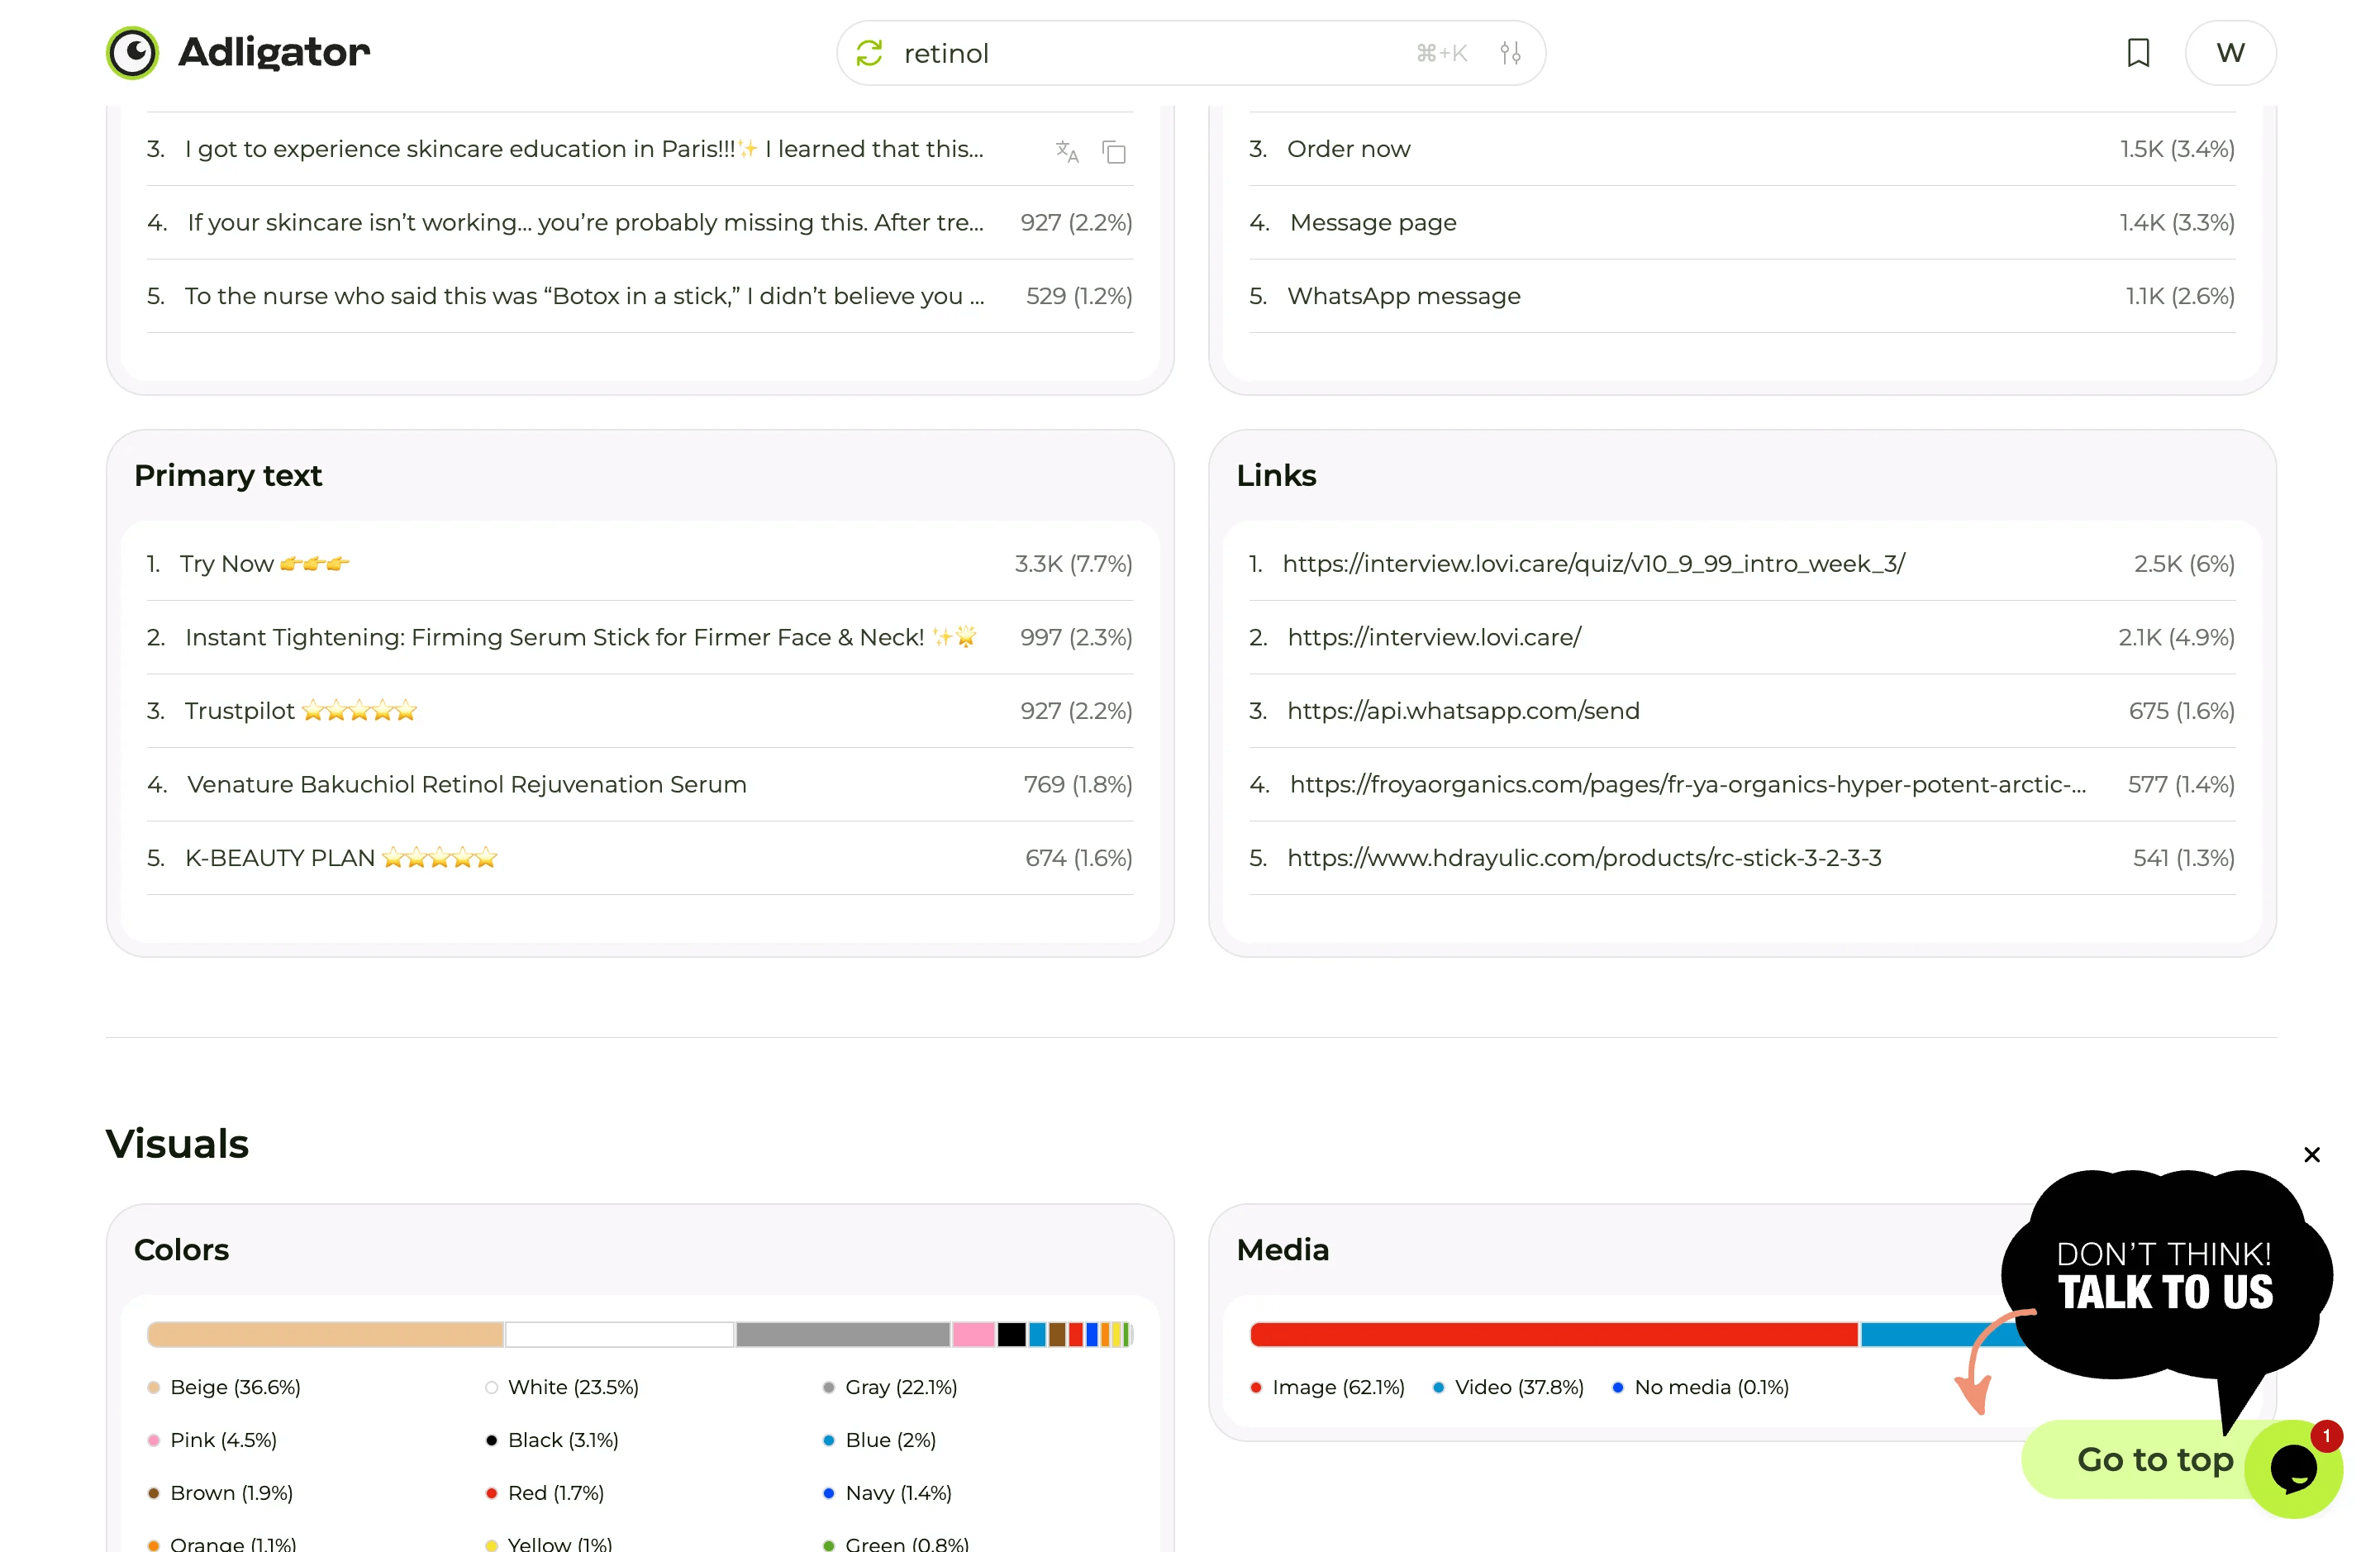
Main text: The top text across the vertical—"Try Now"—3.3K occurrences, 7.7% of all texts.
Links: The #1 link advertisers drive to:
interview.lovi.care/quiz—a quiz funnel that gathered 6% of all clicks for the "retinol" key in a year.CTA (Call to Action): Dominating are "Shop now" (59.3%) and "Learn more" (24.2%)—standard for landing pages. But the arbitrage signal is in the tail: "Message page" (3.3%) and "WhatsApp message" (2.6%) are in the top 5, which is unusual. In most verticals, DM transitions aren't this popular.
Social proof: The phrase "Trustpilot" appears in 927 different creatives.
One screen. Five ready-made funnels to borrow. Collecting them took about two minutes.
Step 5: Anatomy of a Winner
The analytics dashboard pointed to interview.lovi.care/quiz as the #1 link in the retinol vertical. Following the trail through a fresh creative, you land here:
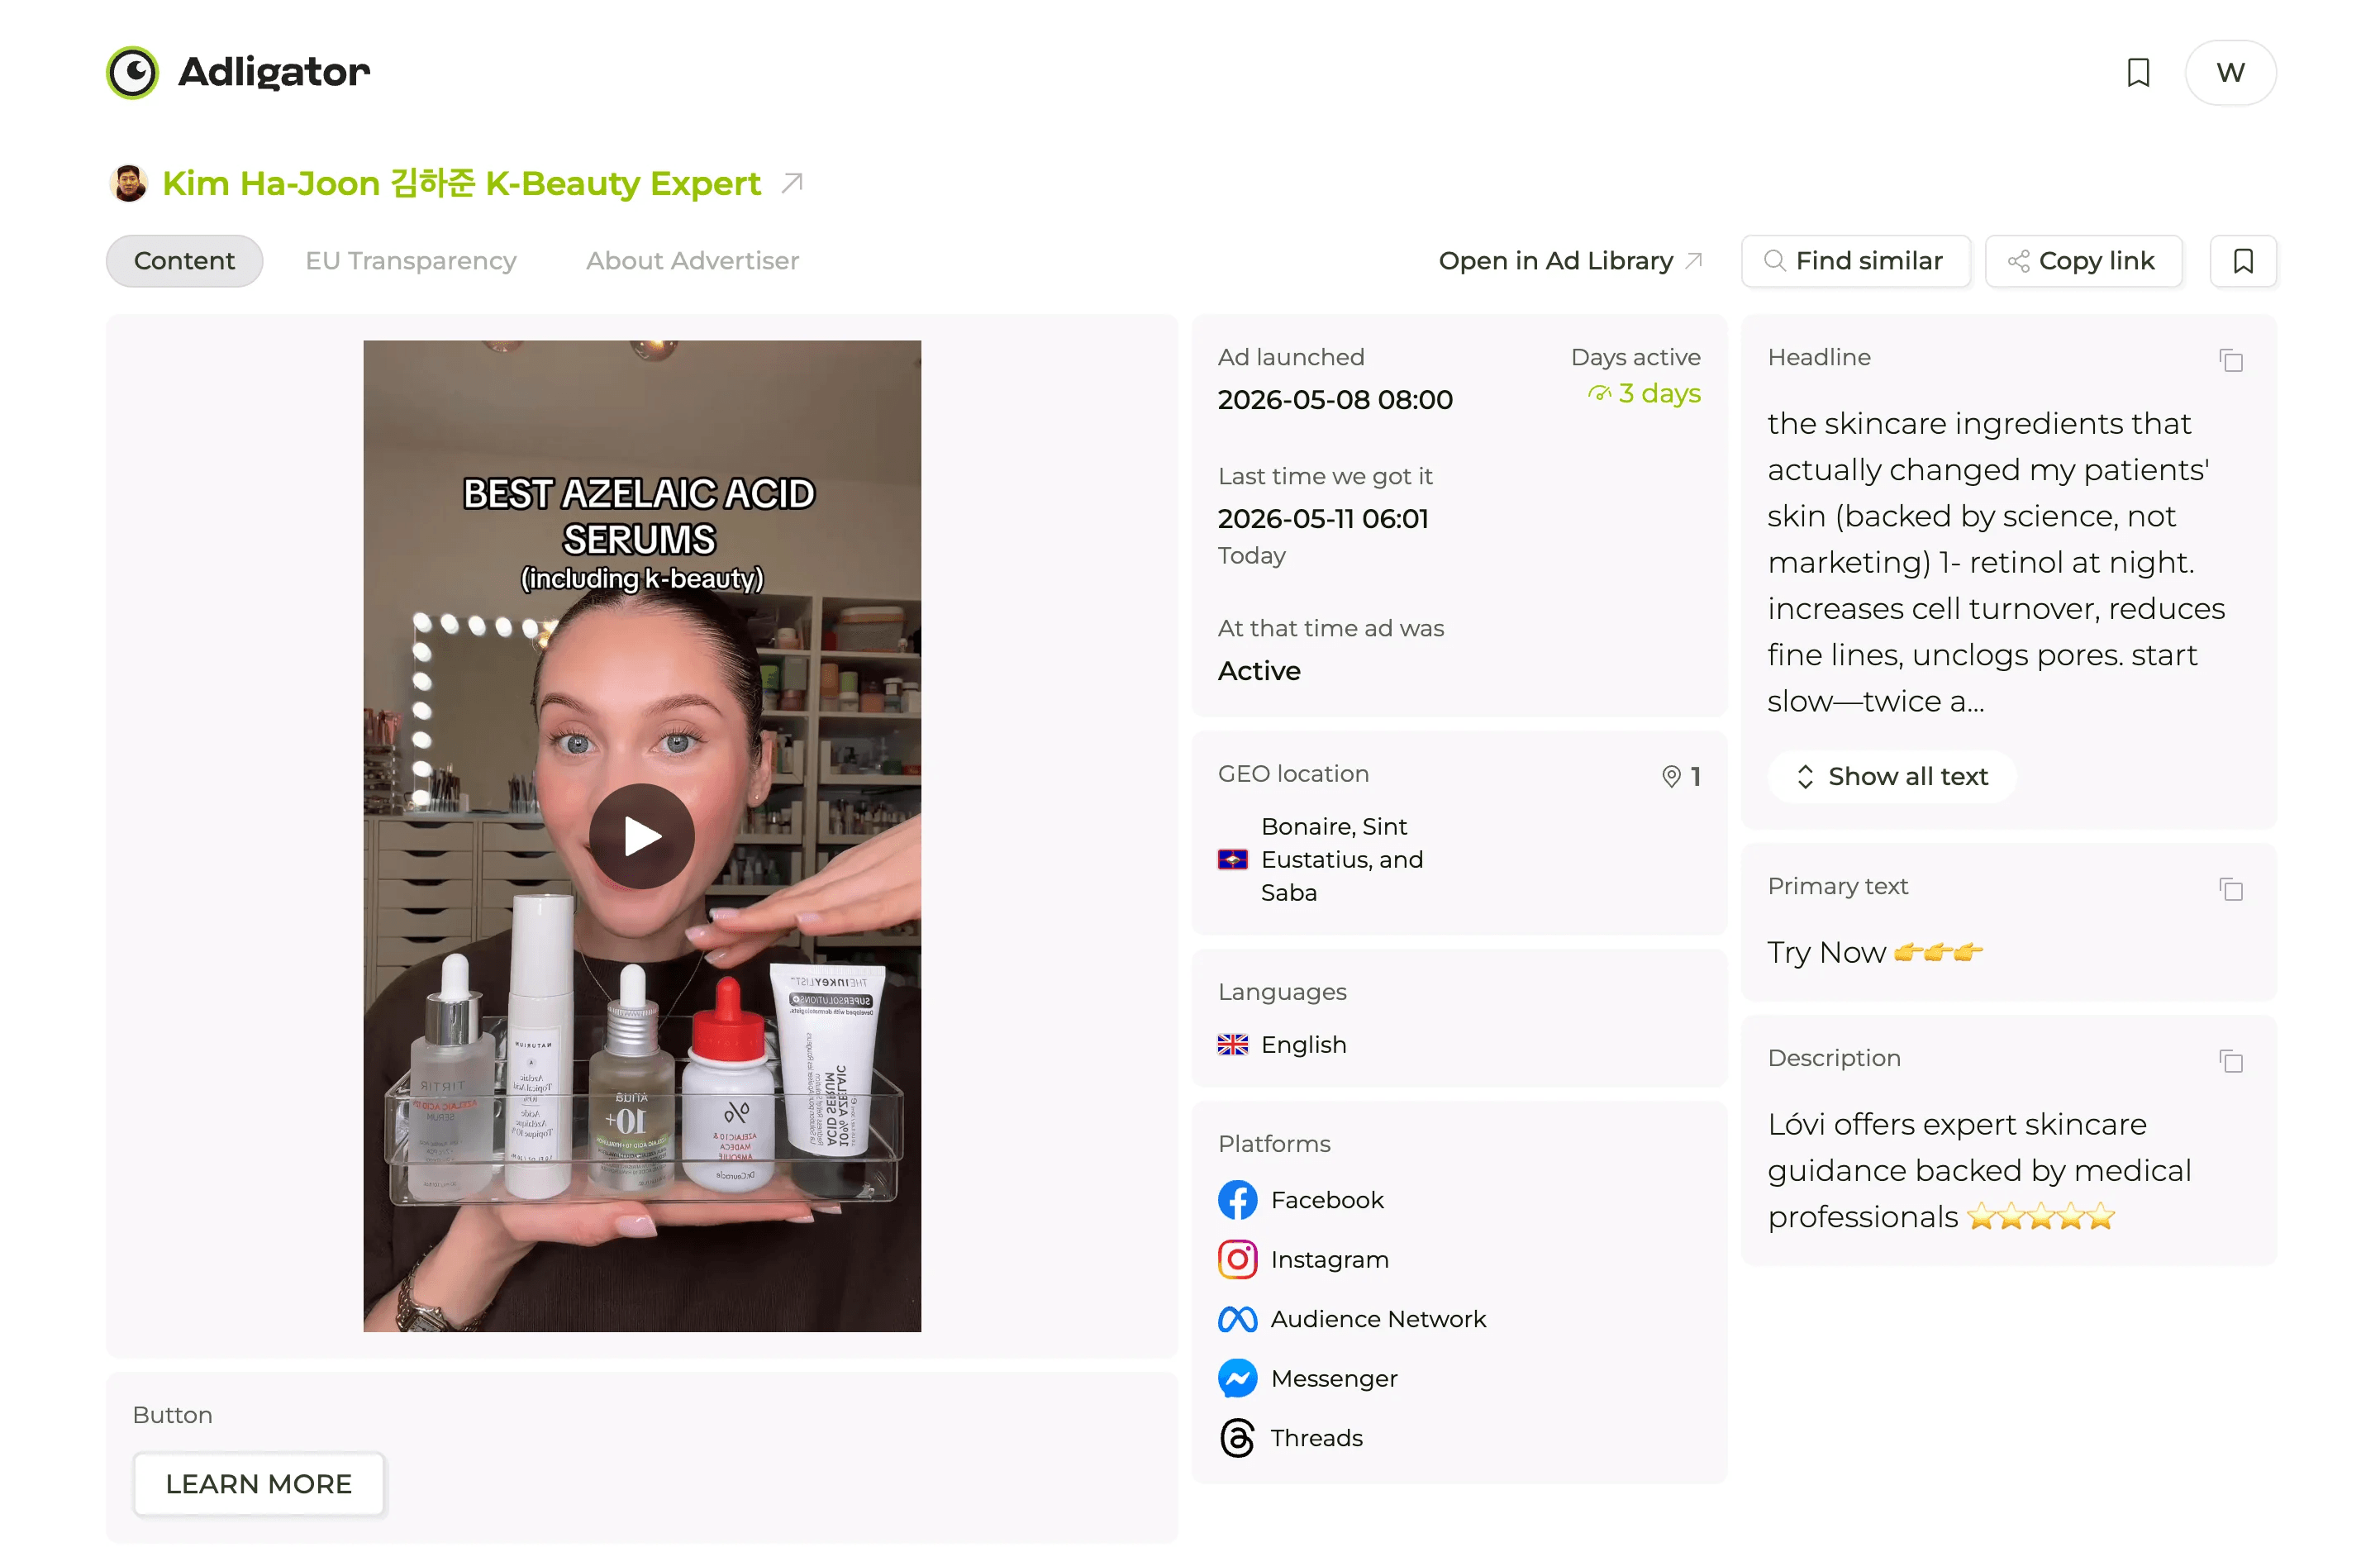
[Detailed creative page in Adligator — Advertiser: Kim Ha-Joon 김하준 K-Beauty Expert. GEO: Bonaire, Sint Eustatius and Saba. Headline: "ingredients that actually changed my patients' skin (backed by science, not marketing)". Text: "Try Now"]
Five things this single screen tells us, all perfectly aligning with the aggregated Analytics data:
Character/Influencer style page. "Kim Ha-Joon 김하준 K-Beauty Expert"—a Korean name plus expert positioning. This is not an official brand page. It’s a classic arbitrage "trustworthy insider" pattern.
Hyper-niche GEO. Bonaire, Sint Eustatius, and Saba. Population: 27,000. This isn't a consumer market—it’s a testing ground for placements or a marker of tax residency.
Angle in the headline. "Skincare ingredients that actually changed my patients' skin (science, not marketing)." Building trust through the denial of marketing is a classic arbitrage trick.
Lovi.care funnel. The destination hiding behind the #1 link in the dashboard. Quiz → personal product recommendation → conversion via DM or landing page.
"Try Now" text—the #1 top text in the entire retinol vertical, used here word for word.
That’s the whole cycle: the Analytics tab shows you the top pattern, and a specific ad shows you its implementation. Save both layers to your swipe file—the pattern and the example.
Your Weekly Research Playbook
Five minutes every Monday morning:
Open the tracker email from Adligator. Scan the new creatives from the last 24 hours — 30 seconds.
Open the Analytics tab in the tracker. Check if the top Headlines / Texts / Links have changed compared to last week — 60 seconds.
Sort by "days active," screenshot the top 3 winners for your swipe file — 90 seconds.
Open the card of one winner. Note the angle in the headline, CTA, GEO, and funnel destination — 60 seconds.
Rotate the tracker once a month. Delete a burned-out keyword, create a tracker for a related key (retinol → niacinamide; Eucerin → CeraVe). New key, new patterns — 30 seconds.
That’s it. Most affiliates spend more than five minutes arguing about TikTok algorithm changes in Telegram chats. This playbook is a far more effective use of time, and most of your competitors aren't doing it.
Find Your Own Winners
The cycle described in this article—semantic collection, GEO comparison, advertiser signals, Analytics dashboard, anatomy of a winner—works in any vertical running on Meta. Skincare, nutra, iGaming, sweeps, crypto, dating. The mechanics are identical; only the keyword map changes.
Five minutes a week. Your competitors will hate it.


Be the first to share your opinion!
We value your feedback — share your thoughts.